SPONSOR LEVEL | PRIVATE VIEW
2026 Sponsor Value Creation Hub
Where lower- and mid-market sponsors
are driving measurable impact.
A concise view of the value levers sponsors are using heading into 2026 across cost,
talent, operating cadence, and integration.
VALUE LEVERS
The fastest paths to value creation in 2026.
In recent sponsor conversations, six levers consistently show up as the most reliable and repeatable sources of near-term value creation.

Cost Optimization Non-Core Functions
Non-Core Functions
Reducing OpEx in non-core areas while maintaining or improving service quality across finance, IT, and back office.
What good looks like: 10–25% cost reductions in non-core functions and vendor spend, without disrupting growth initiatives.
Talent to Value Alignment Critical Roles
Critical Roles
Making sure roles tied directly to the value creation plan are filled with the right leaders and support.
What good looks like: A 12–18 month roadmap aligning talent, org structure, and the value creation commitments made at deal close.
M&A Integration Roll-Ups & Add-Ons
Roll-Ups & Add-Ons
A tighter, more predictable model for integrating add-ons while protecting the original deal thesis.
What good looks like: A 90-day integration playbook that reduces disruption, locks in synergies, and sets the platform up to scale.
Digital Transformation Visibility + Execution
Visibility + Execution
Prioritizing systems and data foundations that improve speed, accuracy, and performance reporting.
What good looks like: Real-time dashboards, automated reporting, and a 3–5 day close with clean, trusted numbers.
Operational Improvement Finance
+ FP&A
Finance + FP&A
Establishing a scalable operating cadence that supports faster, more confident decision-making.
What good looks like: Standardized FP&A, automated variance analysis, and a monthly/quarterly rhythm the CEO can actually run.
Outsourcing to Accelerate Execution Right-Sourcing
Right-Sourcing
Right-sourcing non-core work so execution doesn’t slow down due to internal bandwidth or hiring constraints.
What good looks like: Replacing open roles with fractional and managed services to lower fixed costs and increase speed to value.

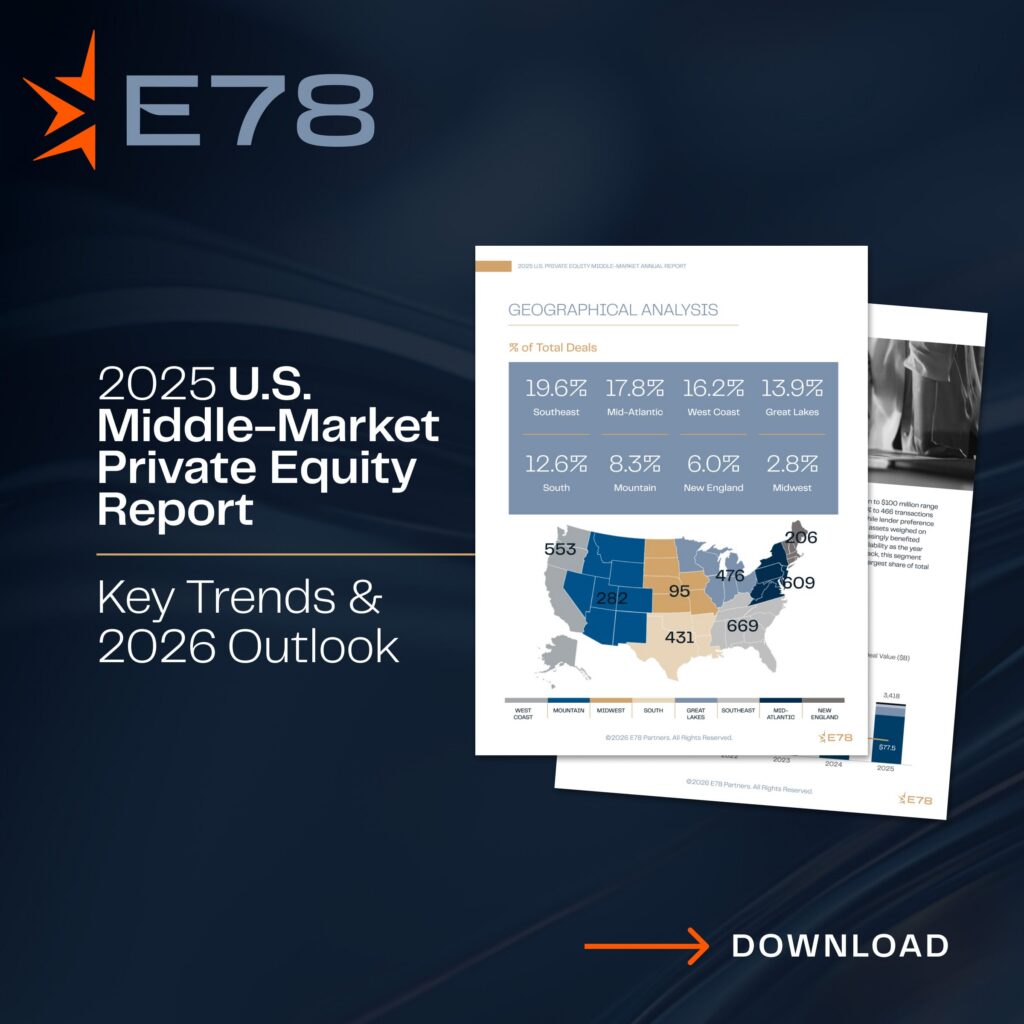
IN-MARKET THEMES
What sponsors are prioritizing right now
Across portfolios, sponsors are focusing on a common set of operational and financial questions as they refine 2026 plans:
- How quickly can we get to clean, reliable unit economics and cash visibility?
- Which non-core functions are candidates for structural cost reduction?
- Where are talent gaps slowing execution of the value creation plan?
Can we standardize FP&A and reporting across platforms and add-ons? - Do we have a repeatable integration model for ongoing M&A?
- What operating cadence will support both growth and exit readiness?
EXECUTION
A 90-day value activation model
A simple model sponsors are using to move from fragmented operations to a repeatable, portfolio-ready operating rhythm.
DAYS 1-30
Diagnostic & Rapid Wins
Cash, KPI, and reporting visibility.
Process mapping across finance and FP&A.
Quick fixes with measurable impact on OpEx and cycle time.
Days 31–60
Process Lock & Controls
Standardized monthly and quarterly reporting cadence.
FP&A templates, assumptions, and variance analysis.
Integration checkpoints and handoffs across functions.
Days 61–90
Automation & Scalability
Systems optimization and automation of recurring tasks.
Real-time dashboards for leadership and sponsors.
A finance model ready to support growth and add-ons.
DAY 90
Outcomes
Clean numbers and faster close.
Real-time visibility into performance and cash.
Lower OpEx in non-core functions.
A repeatable operating rhythm across the portfolio.
Recent Wins
Sponsor-level results (representative, logo-free)
A sampling of outcomes from PE-backed companies we’ve supported across finance, integration, and operating model design:

23% reduction in finance OpEx Timeline:
16 weeks
Timeline:
16 weeks
Rationalized non-core finance and back-office spend across a multi-entity platform while maintaining service quality.
Close reduced from 12 → 3 days Timeline:
90 DAYS
Timeline:
90 DAYS
Implemented a modern reporting cadence and real-time KPI dashboard to give sponsors and management a single source of truth.
4 add-ons integrated under one model Timeline:
<100 days
Timeline:
<100 days
Established a repeatable integration framework covering finance, systems, and reporting for ongoing roll-up activity.
Forecast accuracy improved by 28% Timeline:
2 planning cycles
Timeline:
2 planning cycles
Standardized FP&A, assumptions, and variance analysis across business units to support sponsor-level reporting.
3 open roles replaced with managed services Timeline:
60 days
Timeline:
60 days
Right-sourced key finance roles, lowering fixed costs and increasing execution speed during a critical growth phase.
Portfolio-ready finance function Timeline:
6 months
Timeline:
6 months
Built a scalable finance and reporting model to support both organic growth and acquisition-driven expansion.
NEXT STEP
If these are active priorities in your portfolio
If any of these areas are front-burner topics for you or a portfolio, let’s connect and walk through where we’re seeing the strongest ROI.
This page is intended for sponsor-level use and is not broadly distributed.
Private content shared for sponsor relationships only.